

icnlive

ICN.live

  • China controls the global EV race with ~60% of worldwide sales, driven by extreme scale, policy alignment, and rapid industrial iteration cycles across manufacturers.
  • BYD leads as the global volume benchmark, leveraging full vertical integration to structurally undercut Western automakers on pricing and production efficiency.
  • The market is defined by aggressive price compression, forcing constant innovation and margin sacrifice across both legacy OEMs and emerging EV startups.
  • Chinese EV brands are rapidly expanding into the UAE and the global South, positioning themselves as the default value-layer alternative to Tesla and European luxury EVs.

China’s electric vehicle industry has evolved into the most powerful force shaping the global automotive landscape. What began as a state-supported industrial push has transformed into a hyper-competitive ecosystem where scale, speed, and cost efficiency redefine market leadership. Today, Chinese manufacturers are not only dominating domestic sales but actively compressing global EV pricing structures through aggressive innovation and vertical integration. From ultra-low-cost urban vehicles to advanced premium electric SUVs, the spectrum of offerings reflects a manufacturing system optimized for mass adoption. As Western automakers struggle to match cost and production velocity, China is setting the benchmark for the next decade of mobility. Now, let’s look at some data and insights about the most powerful Chinese EVs so far, Chinese EVs, and why they are so competitive, and what their best-selling cars are.

China is the dominant global EV market, accounting for ~60% of global EV sales and >45% domestic penetration.

  • Annual EV sales: ~10–12M units (run-rate)
  • Market structure: hyper-competitive, price-compressed, vertically integrated
  • Leader: BYD (volume + cost leadership)
  • Strategic reality: China is exporting deflation to global auto markets

Estimated Impact: Extreme—China will define global EV pricing and margins
Confidence Level: High (multi-source consistency)

MARKET SIZE & CAPITALIZATION

Market Scale

  • ~1.49M EVs sold monthly (May 2026 snapshot)
  • ~63% EV penetration rate (China leads globally)

Aggregate Market Cap (Top Chinese EV Players)

Company Market Cap (USD)
BYD ~$125B
Xiaomi ~$118B
XPeng ~$19B
Li Auto ~$16.9B
NIO ~$12B

Total (Top 5): ~$290B–$320B EV exposure.

NOW LET’S SEE THE TOP 5 CHINESE EV COMPANIES

BYD (Market Leader)
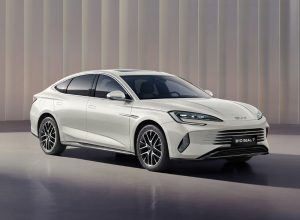
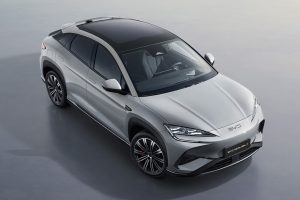
BYD SEAL 7 DESIGNBYD SEALION 7 PERFORMANCEBYD ATTO 8 PERFORMANCE

Overview

  • #1 EV company globally by volume
  • 3.48M EVs sold in China alone (2025)

Best-Selling Models

  • BYD Seagull: ~$10,000–$12,000
  • BYD Dolphin: ~$16,000–$20,000
  • BYD Atto 3: ~$20,000–$30,000

Pros

  • Full vertical integration (battery → chip → assembly)
  • Lowest cost structure globally
  • Massive scale advantage

Cons

  • Lower premium perception vs Western brands
  • Margin pressure due to price wars

Estimated Impact: Dominant global disruptor
Confidence: Very High


Geely (incl. Zeekr)
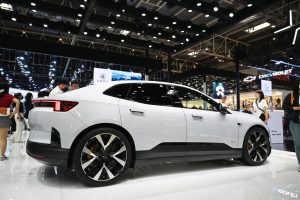
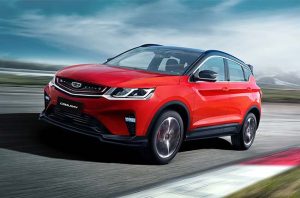
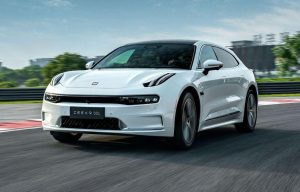
Geely SUVgeely-is-the-best-chinese-brand-for-2019Geely Sport

Overview

  • #2 in China EV market (~11% share)

Best-Selling Models

  • Zeekr 001: ~$40,000–$50,000
  • Geely Galaxy L7: ~$20,000–$30,000

Pros

  • Strong global portfolio (Volvo, Polestar)
  • Premium + mass-market diversification

Cons

  • Brand fragmentation
  • Less cost-efficient than BYD

Estimated Impact: Strong #2 with global leverage
Confidence: High


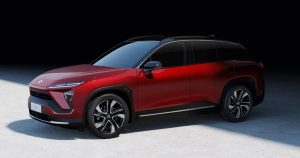
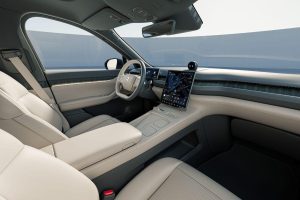
NIO (Premium Segment)
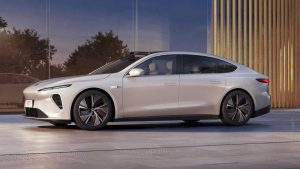
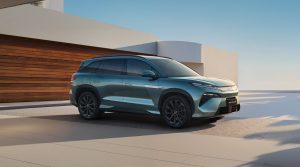
NIO PremiumNIO redNIO Car EV

Overview

  • Premium EV positioning (China’s Tesla competitor)

Best-Selling Models

  • NIO ES6: ~$45,000–$60,000
  • NIO ET5: ~$40,000–$55,000

Pros

  • Battery swapping infrastructure (unique moat)
  • Strong brand in premium segment

Cons

  • High burn rate
  • Profitability issues

Estimated Impact: Niche premium player
Confidence: Medium-High


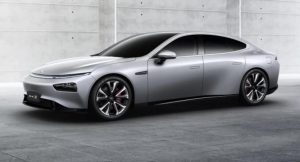
XPeng (Tech-Focused)
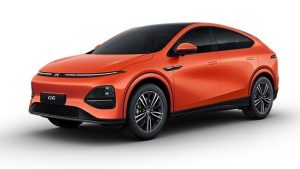
Xpeng SUVXPeng SportXpeng interior

Overview

  • Known for autonomous driving tech

Best-Selling Models

  • XPeng G6: ~$25,000–$35,000
  • XPeng Mona M03: ~$16,500

Pros

  • Strong software + AI positioning
  • Competitive pricing

Cons

  • Weak brand vs BYD/NIO
  • Volatile demand

Estimated Impact: Tech upside, uncertain scale
Confidence: Medium


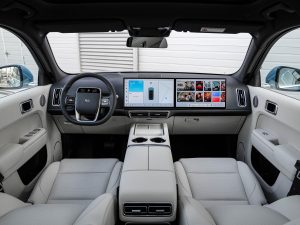
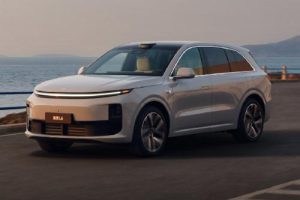
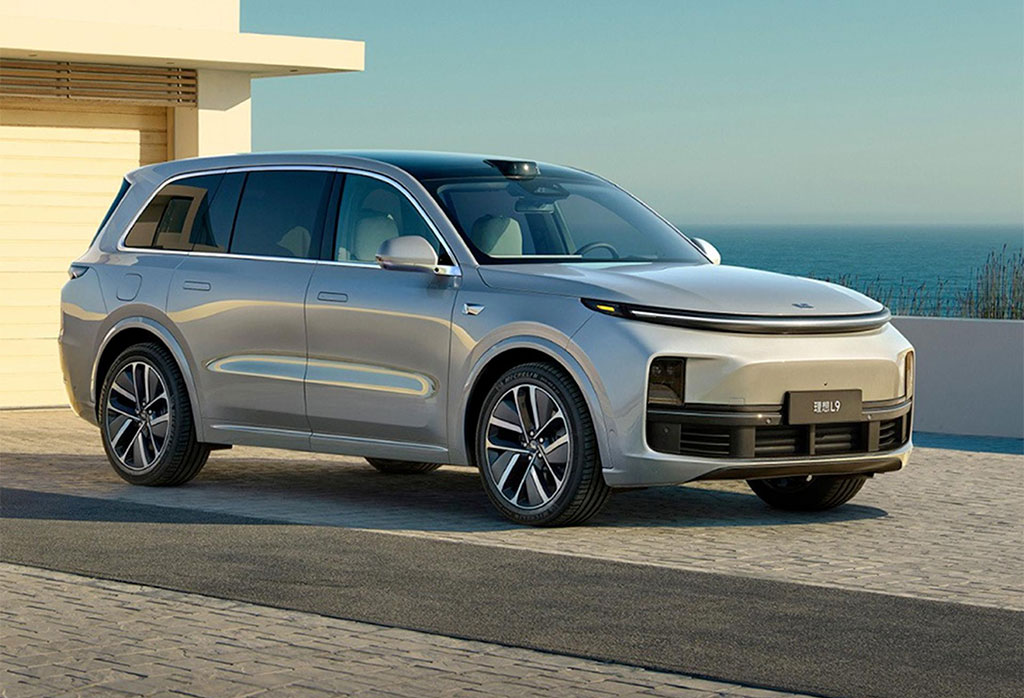
Li Auto (Hybrid-Dominant)
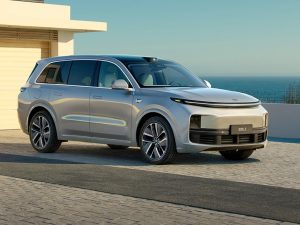
Li SUSLi interiorLI Sub

Overview

  • Focus on EREV (range-extended EVs)

Best-Selling Models

  • Li L6: ~$34,500
  • Li L7/L8/L9: ~$40,000–$60,000

Pros

  • Solves range anxiety (hybrid approach)
  • Strong family SUV positioning

Cons

  • Declining sales momentum
  • Less future-proof vs pure EVs

Estimated Impact: Transitional player
Confidence: Medium


BEST-SELLING EVs IN CHINA (MARKET LEVEL)

Top mass-market winners:

  • BYD Seagull — dominant low-cost urban EV
  • Wuling Mini EV — ultra-cheap segment leader
  • BYD Qin / Song series — high-volume mid-tier
  • Tesla Model Y (China) — premium benchmark

Insight: China’s volume is driven by $10K–$25K vehicles, unlike Western markets.

Chinese EVs are competitive because the entire system is engineered for it. Companies like BYD build their own batteries, chips, and powertrains in-house, stripping out the supplier margins that inflate Western prices. Scale does the rest. Multi-million unit production spreads fixed costs across enormous volume, driving per-car expense down.

The deeper advantage sits in the battery supply chain, which China dominates end to end, from lithium and refining to cell manufacturing. Layer on government policy that aligns subsidies, infrastructure, and regulation to accelerate adoption, plus lower labor costs and faster iteration cycles, and the gap widens further.

Then there is the price war. Domestic hyper-competition compresses margins to the bone, forcing efficiency Western automakers rarely face.

The result is structural, not temporary. China optimizes for volume dominance over margin maximization, producing a durable cost advantage of roughly 20 to 40 percent versus the West. Confidence in that read is very high.

UAE MARKET (200-WORD STRATEGIC OVERVIEW)

The UAE EV market is in an early but accelerating adoption phase, driven by government sustainability targets and a rising fuel diversification strategy. Chinese EV brands are gaining traction due to a combination of aggressive pricing, fast availability, and feature-rich vehicles compared to European imports. Brands like BYD, MG (SAIC), and Geely are expanding distribution networks through local partnerships, targeting mid-income consumers priced out of Tesla and premium German EVs.

Infrastructure remains a constraint but is improving, with Abu Dhabi and Dubai investing in charging networks aligned with UAE Net Zero 2050 goals. Chinese EVs benefit from shorter delivery cycles and lower landed costs, making them highly competitive in fleet, ride-hailing, and government procurement segments.

Consumer perception is shifting from skepticism to value-driven acceptance, especially as build quality improves. The UAE acts as a strategic gateway market for Chinese OEMs to expand into the Middle East and Africa, where price sensitivity is higher.

Key dynamic: Chinese brands are not competing on prestige but on price-performance ratio, which aligns strongly with UAE demand outside luxury segments.

Estimated Impact: High growth, but not yet dominant
Confidence: Medium-High

REVENUE LEVERS (STRATEGIC TAKEAWAYS)

Lever Action Impact Confidence
Distribution Arbitrage Import Chinese EVs into underpenetrated markets (MENA, Africa) Very High High
Fleet Sales Target ride-hailing/logistics fleets with low-cost EVs High High
Charging Infrastructure Invest alongside EV distribution High Medium
Brand Positioning Focus on value, not premium High High
After-Sales Ecosystem Build servicing + parts network High Medium

China’s EV sector is structurally advantaged and globally expansionary. The dominant strategy is not innovation alone, but cost destruction at scale, which Western OEMs are currently unable to match. It will remain an open game on how the rest of the global markets will compete with the Chinese manufacturers, but so far the race has a clear leader ahead. The race is long and can always have unexpected models that will rearrange the list. One thing is obvious, and that is the fact that the end user will always win because, as customers, we have the final vote with our wallets.


TAGS

EXPLORE MORE ON:

Claude Opus 5 release

The Claude Opus 5 release by Anthropic arrived on July 24, 2026, and it puts near-frontier intelligence on the same bill you were paying for Opus 4.8. Anthropic pitches the model as one you reach for every day. It comes close to the intelligence of Claude Fable 5, the company’s top public model, at roughly half the price, and it is now the default on Claude Max and the strongest option on Claude Pro. Think of it as the quick, capable sedan you drive daily rather than the race car you book for one hard lap. Cost sits at the center of the Claude Opus 5 release by Anthropic, and the Claude Opus 5 pricing is the surprise.

Standard use runs $5 per million input tokens and $25 per million output tokens, the same rate as Opus 4.8 and half of Fable 5’s rate. A Fast mode runs about 2.5 times quicker at double the price. The headline feature is the Claude Opus 5 effort setting, a dial you turn per request. Set it low for routine calls and save tokens. Push it high when a problem needs full depth. Anthropic says the model holds quality at lower effort while spending fewer tokens than before, so your real bill can fall even as the price holds steady.

Claude Opus 5 vs Fable 5 on the benchmarks

The Claude Opus 5 release by Anthropic leans on value rather than raw peak scores. On the Claude Opus 5 benchmarks the company published, the model tops its own lineup on Frontier-Bench and GDPval-AA, though it still trails Mythos 5, the restricted top model, on cybersecurity work. The Claude Opus 5 vs Fable 5 comparison is where the case lands. On CursorBench 3.2 at max effort, Opus 5 comes within 0.5 percent of Fable 5’s peak at half the cost per task. ARC-AGI 3, a test of fresh problem-solving, shows a wider gap, with its score running three times the next-best model. For computer use, OSWorld 2.0 has it beating Fable 5’s best result at a third of the cost. Anthropic also reports lab gains, with organic chemistry scores 10.2 points above Opus 4.8 and protein-function predictions 7.7 points higher.

Where Claude Opus 5 coding pulls ahead

The clearest sign of progress turns up in Claude Opus 5 coding tests, where the model checks its own work and keeps going until it clears the task. Anthropic shares one Frontier-Bench job where it got a drawing of a machine part but no way to view it directly. Opus 5 wrote its own computer vision pipeline to read the geometry from raw pixels, then rebuilt the part. No rival model with the same setup solved it across five tries. Handed a real bug in a popular package manager, it traced the root cause and fixed an edge case the community patch had missed.

One engineer at a trading firm used it to build a market data feed for a new exchange in a single sitting, and with no live feed to test against, the model wrote its own test harness to confirm it read the data correctly. The Claude Opus 5 release by Anthropic also brought two beta features, letting developers switch tools mid-conversation without breaking the prompt cache and routing flagged API requests to another model instead of failing. This is the company’s fourth model in under two months, after Mythos 5, Fable 5, and Sonnet 5. If you have wanted a model you can run all day without watching the meter, Opus 5 is built for exactly that.

Dubai Named World's Most Instagrammed City

Dubai is the most photographed city in the world, according to a new ranking of how often destinations appear on social media and in search results.

The study comes from Players Time, which built a scoring system it calls an Instagrammability Score. It combines hashtag counts on Instagram and TikTok with monthly Google search volume, then scales the result from 0 to 100.

Dubai scored a perfect 100. The city has been tagged 147 million times on Instagram and more than 43 million times on TikTok. It draws 3.43 million Google searches a month.

The Burj Khalifa took first place in the separate landmarks ranking. The tower has 10.1 million tagged posts and 1.1 million monthly searches. That puts it well ahead of the Grand Canyon at 696,000 searches and the Eiffel Tower at 662,000.

That result is worth sitting with. The Burj Khalifa opened in 2010. It is now photographed and searched more than monuments that have been standing for centuries. The Eiffel Tower came second with a score of 73.22. The Taj Mahal and Machu Picchu both landed in the top group, with search volumes between roughly 854,000 and 928,000 a month.

Europe holds 8 of the top 20 landmark places. The Sagrada Familia and the Colosseum sit in that group, with monthly searches running from about 313,000 to 737,000.

Some places are ranked for the experience, not the building

A few entries in the landmarks list are not really buildings at all.

Shibuya Scramble Crossing in Tokyo generated more than 6.57 million posts. Up to 3,000 people cross at once, and most of the photos are taken from inside the crowd rather than from a viewing point. Times Square in New York works the same way, with 5.82 million posts.

The oddest entry is the DUMBO viewpoint near the Brooklyn Bridge, which has passed 4 million Instagram posts on its own. Search demand for it is modest. People are not planning trips there. They walk past, take the photo, and the number keeps climbing.

London posts more, Barcelona searches more

Among cities, London and Paris follow Dubai. London recorded the highest raw hashtag volume in the study at 192.2 million posts. New York City reached 165.6 million and Istanbul 153.7 million.

Barcelona is the outlier. The city recorded 97 million tagged posts and 23 million monthly Google searches, which is close to seven times Dubai’s search volume.

That figure deserves a caveat the study does not offer. “Barcelona” is also the name of one of the most followed football clubs on the planet. A raw keyword count cannot tell a fan looking for match results apart from a traveller looking for a hotel. The same problem may explain why San Diego, Santiago and Kochi appear in a ranking of visual destinations despite far lower travel profiles.

Players Time has not published the weighting behind its score, so the gap between hashtag volume and search demand is difficult to check independently. Hashtag counts are also self-reported by the platforms and change constantly.

The Dubai finding survives those questions better than most. The city leads on both measures at once, and it does so against capitals that have had a hundred years’ head start on accumulating images. The Burj Khalifa did the same thing at landmark level in sixteen years.

Kuwait $6 billion bond sale

The Kuwait $6 billion bond sale closed this week with an order book the finance ministry calls one of the largest for a multi-tranche sovereign deal in 2026. Three tranches went out. Investors took $3 billion in three-year paper, $1.5 billion in five-year notes and $1.5 billion at 10 years. Final spreads landed at 70, 75 and 85 basis points over US Treasuries. It was the country’s first international issuance since October last year.

Pricing tells you more here than the headline number does. Kuwait tightened 25 basis points across all three tranches from its opening levels, according to a person familiar with the deal cited by Bloomberg. Buyers do not give up that much yield to a borrower they distrust.

Demand for the Kuwait $6 billion bond sale came in two versions. The finance ministry put total orders above $18 billion, more than three times the issue size. Bloomberg reported books near $14.8 billion at final terms. Peak interest and final interest are different numbers, and both can be accurate.

Who bought the Kuwait $6 billion bond sale?

American accounts took 48 percent of the allocation. The UK and Europe followed with 28 percent, then the Middle East and North Africa at 16 percent. Asia took 4 percent, and other international markets took the rest. Finance minister Yaqoub Al-Refaei said the result shows investor confidence in Kuwait’s credit position and financial standing.

The short end did the heavy lifting. Half the total sat in the three-year tranche, which points to buyers who want yield without long duration risk. Five- and 10-year paper gives other Kuwaiti borrowers a benchmark to price against.

Geography matters more than usual on this one. JPMorgan reclassified Kuwait as a developed market in February 2025 and removed it from its emerging market bond index. That move stripped out index-driven demand the country once attracted by default. Pulling almost half the book from the Americas without that support is a real result for a Kuwait sovereign bond issuance.

War risk barely moved the price

Iranian attacks have hit US military assets in Kuwait and Bahrain in recent weeks. Fixed income desks priced the three-tranche bond sale anyway. Gulf sovereign bonds already went through this test once, falling to lows in mid-March before climbing back through late April. Traders have a reference point now, and they used it.

Why Kuwait keeps borrowing

The arithmetic is plain. Kuwait’s 2026-27 budget forecasts revenue of KD16.3 billion against spending of KD26.1 billion. That leaves a Kuwait budget deficit of KD9.8 billion, up from KD6.3 billion the year before. Oil was expected to supply close to 80 percent of budgeted revenue, so disruption around Hormuz cuts straight into the top line.

Access came back through legislation. The Kuwait public debt law, approved in March 2025, set the borrowing ceiling at KD30 billion, roughly $97.4 billion, and allowed maturities out to 50 years. Political gridlock had kept the country out of the sovereign market for eight years before that. Since the law passed, Kuwait raised $11.25 billion in October 2025 and another $2 billion in May.

Kuwait is building a yield curve, and curves need repeat business. Each deal hands domestic banks and corporate borrowers a pricing reference they did not have. I read the Kuwait $6 billion bond sale as a curve-building exercise first and a cash-raising one second. The deficit is real. So is the sovereign wealth sitting behind it. What global investors bought this week was the legal framework and the balance sheet, not the news cycle.

Share this post

on your favourite social platforms

or copy the link