



icnlive

WATCH LIVE. THINK BUSINESS.

© 2026 ICN.LIVE

Sheikh Khaled chairs Abu Dhabi Council, and its latest meeting placed an agentic AI platform inside government decision-making for the first time.

Trending Economy

Dubai Economic Signals

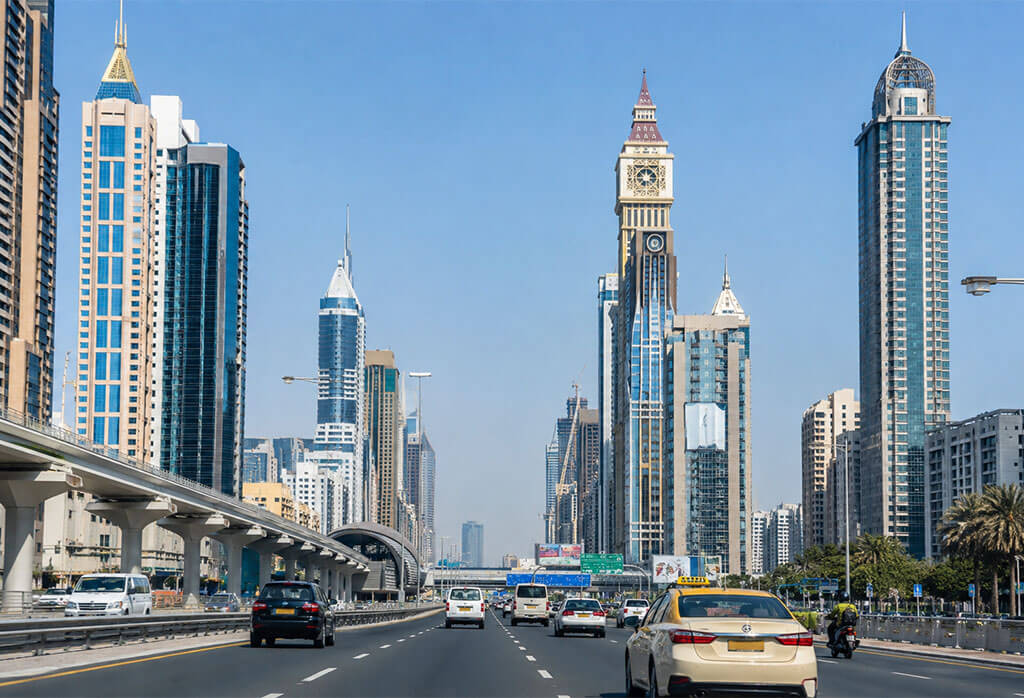
For investors trying to read Dubai’s economy before the next GDP release, some of the most useful signals come from daily city activity. Three datasets deserve closer attention: electricity consumption, taxi trips, and parking transactions.

They measure different forms of economic activity. Together, they can create a practical early reading of how the city is behaving. These are Dubai Economic Signals because they originate from infrastructure people and businesses use every day. They do not depend on surveys or quarterly corporate reporting.

DEWA: The electricity behind economic activity

Electricity demand provides one of the clearest physical measures of activity. Dubai Electricity and Water Authority generated 11.09 TWh of electricity in the first quarter of 2026, up 5.65% from the same period a year earlier. Its customer base also increased by 65,086 accounts over the previous 12 months, reaching 1.347 million accounts at the end of March.

The combination matters more than either number alone.

Rising consumption can reflect greater occupancy, construction activity, commercial operations, and industrial demand. Rising customer accounts can indicate continued expansion in Dubai’s residential and business base. DEWA’s 2025 figures provide another reference point. Peak power demand reached 11.39 GW, up 5.83% year on year. Water demand also increased during the year.

For investors, the useful observation is the direction and persistence of these movements.

Dubai Taxi: A live mobility reading

Taxi activity gives a faster view of movement through the city. Dubai Taxi Company reported 10.3 million taxi and limousine trips during Q2 2026. Volumes declined 24.4% year on year during the quarter, after weaker airport and tourism demand. Yet the monthly pattern moved sharply higher. Trips increased about 31% between April and June. June volumes were 11.2% below June 2025, compared with a 36.7% decline in April.

That monthly progression is more useful than a single quarterly number. It shows how rapidly mobility demand can recover after a period of weakness. For Dubai Economic Signals, taxi data therefore works as a high-frequency mobility indicator. It can help identify shifts before broader economic statistics arrive.

Parking: Where vehicles become economic activity

Parking data adds another layer.

Parkin manages approximately 207,000 paid parking spaces across Dubai. Its network covers roadside spaces, plots, multi-storey facilities and selected privately owned locations. During Q1 2026, public parking transactions reached 28.5 million. Developer parking transactions increased 57% year on year to 5.9 million. Parkin also reported 195,200 public parking spaces, up 4% from the previous year.

The data needs careful interpretation because Dubai’s flexible parking tariff structure affects transaction patterns. Still, parking provides something taxi data cannot: evidence of vehicles stopping within specific commercial and residential areas.

That makes it useful for assessing activity around offices, retail districts and mixed-use developments. For Dubai Economic Signals, the strongest reading comes from combining transaction volume with utilisation, seasonal permits and geographic distribution.

Reading the three together

The objective is not to declare an economic recovery from one number. The stronger approach is to look for consistent movement across independent datasets. If electricity consumption rises while taxi activity improves and parking utilisation increases, the evidence points toward broader activity across the city. If only taxi trips rise, the movement may reflect tourism or specific events. If electricity consumption rises while parking activity weakens, the explanation may sit elsewhere, including new capacity, residential occupancy or infrastructure demand.

That is why these Dubai Economic Signals work best as a monitoring system rather than isolated statistics. For investors, the advantage comes from tracking the direction, speed, and divergence of the data each month. The market usually receives economic information after activity has already occurred. These city-level indicators offer a way to watch the activity itself.

That makes Dubai Economic Signals useful for investors assessing Dubai’s next phase of economic performance.
DEWA record profit

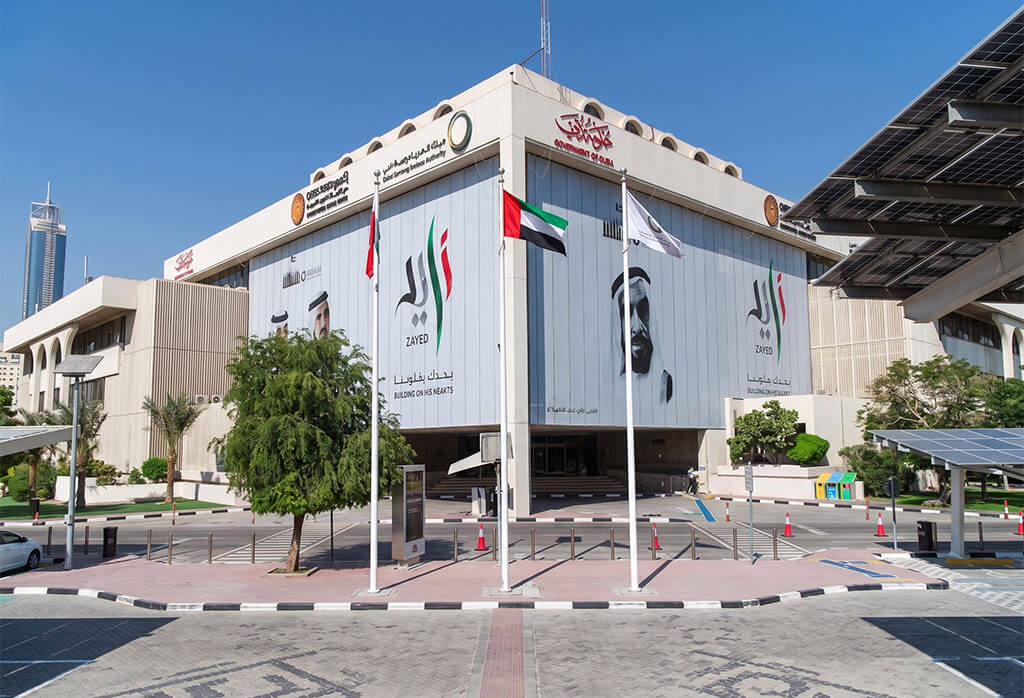
DEWA’s record profit for the first half of 2026 reached AED3.33 billion, a rise of 15.02 percent from the same period last year. Behind that single figure sits a simple story. More people and businesses in Dubai are using power, water and cooling, and the utility is selling more of all three.

The DEWA record profit was one of four results to hit a first-half high. Revenue reached AED14.86 billion. EBITDA, a measure of core earnings before interest, tax and accounting charges, came in at AED7.32 billion. Operating profit landed at AED4.07 billion. The DEWA net profit line, up 15.02 percent, drew most of the coverage.

Where the growth came from

Demand did much of the work. Dubai Electricity and Water Authority added 18,220 customer accounts in the second quarter alone. Over the year to 30 June 2026, the account base grew by 72,718, or 5.63 percent. When a customer list expands at that pace, revenue tends to follow.

Supply kept up. The company generated 15.78 TWh of electricity in the second quarter. It also produced 40.25 billion imperial gallons of desalinated water, the drinking supply a desert city leans on.

How DEWA’s record profit links to clean energy

DEWA clean energy is a growing part of the picture. In the second quarter, clean sources supplied 3.14 TWh, or 19.9 percent of all power generated. By the close of the first half, installed capacity stood at 17,979 MW, with 3,860 MW from clean sources. That share works out to 21.5 percent of the energy mix.

Water infrastructure grew too. DEWA switched on Block A of the Hassyan Sea Water Reverse Osmosis plant, adding 60 MIGD of capacity. Reverse osmosis, which pushes seawater through fine membranes, now covers 23 percent of the utility’s desalination. Another 120 MIGD of that technology is planned this year.

The 2030 targets are on track. The plan stretches well past this report. By the end of 2030, the company aims for more than 23 GW of installed power capacity and 735 MIGD of water production. Around 8.3 GW of the power, or 36.1 percent, would come from renewable sources. For water, 308 MIGD would use reverse osmosis run on renewable energy.

What it means for shareholders

Here is the part investors watch. DEWA dividend payments follow a set policy. The company plans a minimum of AED6.2 billion a year across its first five years as a listed firm, split into two payments each April and October.

In April 2026, the utility paid AED3.1 billion for the second half of 2025. A further AED3.1 billion for the first half of 2026 is expected in late October, subject to approvals. Saeed Mohammed Al Tayer, Vice Chairman and MD & CEO, confirmed the plan alongside the DEWA H1 2026 results.

Strip away the detail, and DEWA’s record profit rests on one trend. A growing city needs more power and water, and the firm that supplies both is turning that demand into steady earnings and regular payouts.

ADNOC Gas Q2 2026 net income

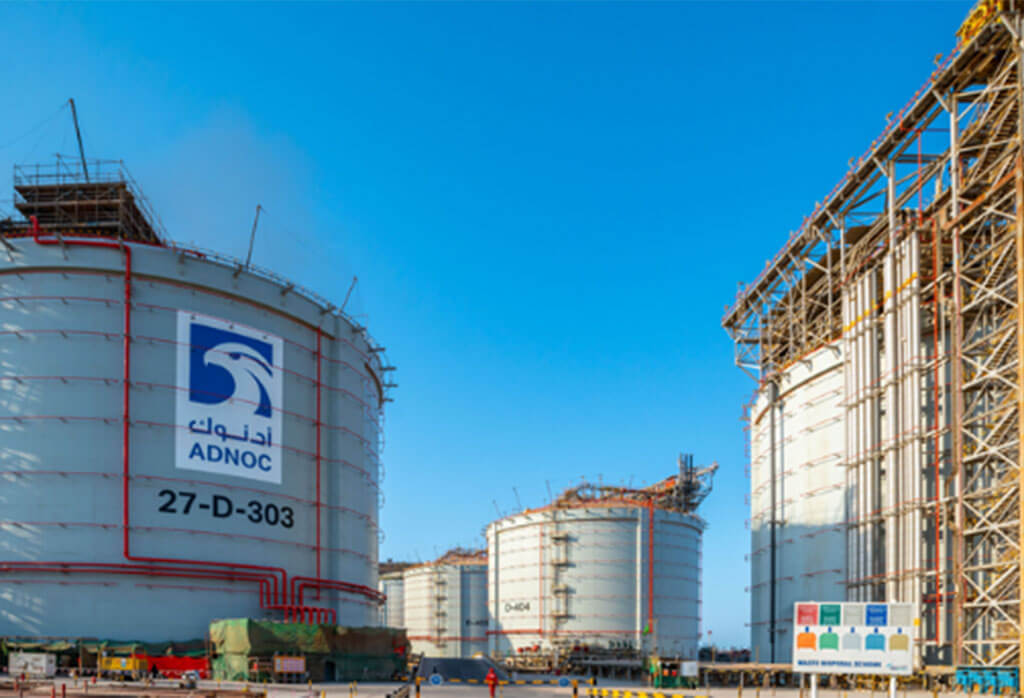
ADNOC Gas Q2 2026 net income reached $665 million, a figure that carries the strain of the months behind it. In early April, security-related incidents hit the Habshan processing site, and Reuters tied them to intercepted drone and missile attacks in the region. Supply from the site fell. Shipping through the Strait of Hormuz slowed. The company still cleared the top of its own forecast, which had run from $400 million to $600 million.

Margins in the domestic gas business held firm, and that steadiness carried the numbers when exports came under pressure. Recovery at Habshan moved faster than planned. Gas supply returned to 85 percent, past the year-end target the company had set in May. Managers leaned on inventory and rerouted logistics to keep customers supplied while the Strait of Hormuz disruption dragged on. ADNOC Gas supplies close to 60 percent of the UAE’s sales gas and reaches customers in more than 20 countries, so a stalled export lane touches a wide base. None of it erased the damage. It softened the edges.

A larger bet behind the numbers

The quarter’s real weight sits in a decision made beside it. ADNOC Gas took final investment decisions on Phases 2 and 3 of its Rich Gas Development project and awarded $8.2 billion in engineering, procurement and construction contracts. Wison Engineering won the $3.9 billion Phase 2 award to build a new gas processing train at Habshan. Tecnimont took the $4.3 billion Phase 3 award for a natural gas liquids fractionation train at Ruwais. Added to the $5 billion Phase 1 committed in 2025, total spending on the project reaches $13.2 billion. Chief Executive Officer Fatema Al Nuaimi framed the awards as a step up in ambition rather than steady progress.

ADNOC Gas Q2 2026 net income against a longer plan

Set against that spending, the ADNOC Gas Q2 2026 net income reads as one marker on a long line. The company lifted its ADNOC Gas EBITDA growth 2030 target to 60 percent versus 2023, up from an earlier goal of more than 40 percent through 2029. Reaching it means roughly $28 billion of investment between 2026 and 2030. Four megaprojects anchor the plan: Ruwais LNG, MERAM, the Rich Gas Development work, and Estidama, together expected to generate $13.4 billion in In-Country Value. MERAM is due in 2027, with the others advancing on schedule.

Part of the efficiency story runs through hardware. ADNOC Gas is putting aerial drones, four-legged inspection robots and tank-climbing crawlers across its sites. The company says the tools can cut some inspection costs by up to 75 percent and finish certain checks as much as 15 times faster. They also pull workers out of hazardous spots. The direction points toward more autonomous operations over time, and it feeds the same goals behind the earnings.

Dividend and the road ahead

Shareholders drew a clear signal. The board approved a $940 million ADNOC Gas dividend for September, holding to a promise of 5 percent annual dividend growth through 2030. ADNOC Gas remains the largest dividend payer on the Abu Dhabi exchange. Guidance for the third quarter runs from $600 million to $800 million, and it assumes the Strait stays contested. If maritime routes reopen by the fourth quarter and pricing steadies, the company expects full-year net income between $3.5 billion and $4 billion. The ADNOC Gas Q2 2026 net income gives that range a firmer base. Read against a year ago, the picture is harder. Reuters reported net income fell 52 percent from $1.39 billion in the same quarter of 2025. The ADNOC Gas Q2 2026 net income shows a company earning through the pressure, not around it.