icnlive

WATCH LIVE. THINK BUSINESS.

© 2026 ICN.LIVE

ICN.live

PUBLISHED BY ICN PRESS

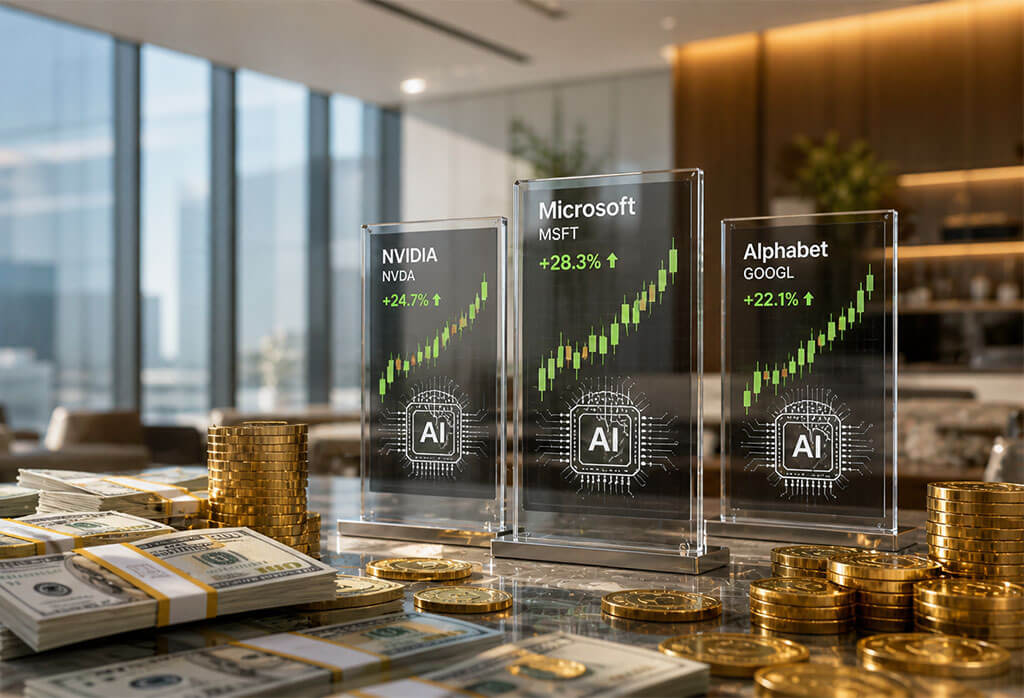
  • Hyperscaler capex is doubling in 2026 to ~$725B. Microsoft, Alphabet, Amazon, and Meta are driving the largest cycle in tech history.
  • NVIDIA (NVDA) trades at just ~24x forward earnings despite 70%+ revenue growth and 60% EBIT margins.
  • Alphabet (GOOGL) is the only true full-stack AI play. Owning data, Gemini models, TPU chips, cloud, and distribution;
  • TSMC (TSM) is the unavoidable chokepoint of the entire AI build-out. HPC now drives 61% of revenue, and gross margins hit 66.2%.

This analysis reflects publicly available data as of early May 2026. Markets move; these break. Re-underwrite quarterly.


1. MARKET CONTEXT

Macro setup. We are in the middle of the largest concentrated capex cycle in technology history. The four hyperscalers (Microsoft, Amazon, Alphabet, Meta) collectively raised their 2026 AI capex to roughly $725 billion — a 77% increase over 2025’s record $410 billion. Add Oracle, and you cross the $750B mark. This now represents roughly 2.2% of US GDP, and the five hyperscalers plan to add about $2 trillion of AI-related assets to balance sheets by 2030. Capex of this magnitude is funded partly from cash piles and partly from debt — big tech issued $100B of bonds in early 2026 to fund AI capex, with investors demanding record CDS protection. That tells you the bond market is pricing in tail risk. Yahoo Finance + 2

Where we are on the adoption curve: mid-stage, infrastructure-heavy, application-light. Hyperscalers report markets are supply-constrained, not demand-constrained; OpenAI ended 2025 at ~$20B ARR, a threefold increase YoY. Microsoft has an $80B backlog of Azure orders that cannot be fulfilled due to power constraints. Translation: the bottleneck is not “will customers buy?” — it is “can we deliver the chips, the power, the data centers fast enough?” Futurum GroupFuturum Group

Tailwinds: sustained capex visibility through 2027 (Alphabet’s CFO already guided “significantly higher” 2027 capex), enterprise contract backlogs locking in multi-year revenue (Google Cloud’s backlog roughly doubled QoQ to $460B), and pricing power in scarce nodes (TSMC raised advanced node prices and saw HPC hit 61% of revenue).

Risks (don’t skip these): (1) ROI question — two-thirds of Microsoft’s capex is going to short-lived GPU/CPU assets that depreciate in 3–5 years, meaning depreciation hits operating margins almost immediately while revenue ramps later; (2) at 20% annual depreciation on $2T of planned AI assets, hyperscalers face $400B annual depreciation by 2030, more than their combined 2025 profits; (3) capex-to-stock-return is historically a poor relationship — when investment intensity peaks, returns tend to soften; (4) China export controls remain an open wound for Nvidia specifically; (5) the AI bubble debate is no longer fringe — Meta dropped 6% on its capex guide, signaling investor patience is now conditional on revenue scaling. On my OmComsoc

The capital allocator’s takeaway: This is not 1999. Revenue is real, backlogs are contracted, and the bottleneck is physical (power, fabs). But the marginal dollar of capex is producing less marginal revenue than two years ago. The right strategy is to own the chokepoints and the proven monetizers — not the speculative downstream applications.


2. SELECTION CRITERIA — WHO MAKES THE CUT

Of the universe I considered (Nvidia, Alphabet, Microsoft, Amazon, Meta, TSMC, Broadcom, ASML, AMD, Oracle, Palantir), three names hit at least 5 of the 6 filters with the cleanest risk/reward profile:

Filter NVDA GOOGL TSM
Revenue growth >20% ✅ ~70%+ ✅ 22% (Cloud +63%) ✅ 35–40%
AI value chain position ✅ Chips (dominant) ✅ Full stack ✅ Foundry monopoly
Margin expansion/profitability ✅ 71% GM, 60% EBIT ✅ Op margin +200bps ✅ 66% GM, 58% op margin
Moat ✅ CUDA + ecosystem ✅ Data + distribution + TPU ✅ Process node monopoly
Smart money / institutional
Operating leverage

I deliberately excluded Microsoft (great business, but most expensive of hyperscalers and stock down 17% YTD reflects the highest investor anxiety on capex/FCF tradeoff), Meta (consumer ad payback path is hardest to verify and stock just got punished), and Amazon (best long-term but FCF turning negative this year creates a dirty entry window). I excluded Palantir on valuation — fundamentals are good, but the multiple prices are perfect.


3. TOP 3 — DEEP ANALYSIS

Pick #1: NVIDIA (NVDA)

A. Investment Thesis

  • Owns the picks-and-shovels of the AI era with the only software ecosystem (CUDA) that has ~15 years of accumulated developer mindshare — every meaningful AI workload was built on it
  • Q4 FY26 revenue grew 73% YoY to $68.1B, with data center now over 91% of sales; net income nearly doubled to $43B — this is software-like operating leverage on hardware revenue CNBC
  • Q1 FY27 guidance of $78B (±2%) beat consensus of $72.6B and explicitly excludes any China data center revenue — meaning the upside case if/when China resolves is pure optionality CNBC
  • Hyperscaler capex doubling in 2026 flows directly into Nvidia’s order book; the company is the most direct beneficiary of the $725B spend
  • Annual product cadence (Hopper → Blackwell → Rubin) means competitors are perpetually one generation behind

B. Financial Strength $51.1B net cash, 71.1% gross margin, 60.4% LTM EBIT margin. Free cash flow conversion is exceptional. The inflection point is already in the rearview — the next inflection is whether they can sustain growth deceleration gracefully (going from 70%+ to 30–40% growth without multiple compressions). TIKR

C. AI Leverage the most direct possible. Roughly 90% of revenue is AI-related. Position in the stack: foundational silicon layer. Every dollar of hyperscaler AI capex routes through Nvidia until alternatives mature.

D. Competitive Edge CUDA is the moat that nobody talks about correctly. Hardware can be replicated; 15 years of developer libraries, optimized kernels, and trained engineering talent cannot. Custom silicon (Google TPU, Amazon Trainium, Microsoft Maia) is the real long-term threat — it’s already cannibalizing Nvidia’s share at the largest customers. But for the merchant market (every other enterprise, every neocloud, every sovereign AI program), Nvidia remains the default.

E. Valuation Reality Check Nvidia trades at ~24x NTM P/E, the cheapest of its closest peers — Broadcom is 31x, ASML 36x, AMD 53x. For a company growing 70%+ with 60% EBIT margins, this is mathematically anomalous. The discount exists because of China’s overhang and peak-cycle anxiety. For a 2–3x return: revenue compounds at 30%+ for three years (entirely plausible given backlog), multiple holds at 24–28x, China optionality returns to the model. Base case = ~80–100% upside in 3 years, bull case = 2.5x. TIKR

F. Risk Factors

  • Execution: Yield problems on Rubin or supply chain disruption at TSMC would be material
  • Market: Hyperscaler in-house chips taking 20–30% share by 2028 is the consensus bear case and likely correct
  • Regulatory: China export controls could tighten further; Taiwan geopolitical risk is the unhedgeable tail
  • Competition: AMD’s MI400 cycle is real; Broadcom’s custom ASIC business is growing faster

Pick #2: ALPHABET (GOOGL)

A. Investment Thesis

  • The only company with a credible full-stack AI position: own data (Search, YouTube, Maps), own model (Gemini), own chip (TPU), own cloud, own distribution (3B+ Android users) — no competitor has all five
  • Q1 2026 revenue $109.9B (+22%), operating income +30% to $39.7B, operating margin expanded 200bps to 36.1% — margin expansion in a heavy capex year is the signal that matters TIKR
  • Google Cloud revenue grew 63% to $20B with backlog nearly doubling QoQ to $460B — this is the most tangible evidence in the sector that AI capex is converting into customer demand SEC.gov
  • The Search-cannibalization-by-AI bear case has been quietly disproven: Search revenue grew 19% to $60.4B with AI Overviews driving usage, and Gemini processes 16 billion tokens per minute Perplexity
  • TPU is the under-appreciated asset — it gives Google cost-per-token economics that no merchant cloud can match

B. Financial Strength 22% top-line growth at $440B+ run rate with expanding margins is rare at this scale. Cloud operating income tripled to $6.6B from $2.2B YoY — this segment has flipped from cash drag to profit engine. The financial inflection point is occurring now: Cloud margins crossing into the 30%+ range over the next 24 months would re-rate the entire equity. Yahoo Finance

C. AI Leverage Indirect but compounding. Search ad monetization gets a quality lift from Gemini. Cloud captures third-party AI workloads. Workspace AI add-ons monetize the install base. Waymo is a free option. Gemini’s improved intent understanding now monetizes longer, more complex queries that were previously difficult to monetize — that’s pure margin. TIKR

D. Competitive Edge Search distribution + ad infrastructure is a 25-year moat that AI competitors must reproduce from scratch. The DOJ antitrust overhang is the principal risk to this moat. The TPU stack means even if Nvidia GPUs get expensive, Google has cost-advantaged inference internally.

E. Valuation Reality Check Forward P/E of ~25x. Trades at 19.3x NTM EV/EBITDA versus Meta at 10.3x — premium reflects Cloud acceleration and the integrated stack, but raises the execution bar. For a 2–3x return: Cloud compounds at 40%+ for 2–3 years, Cloud operating margins expand to 30%+, antitrust doesn’t force a Chrome/Android divestiture, AI Overviews monetization holds. Base case = ~60–80% upside, bull case = 2x. CoinDCXTIKR

F. Risk Factors

  • Regulatory: DOJ remedy phase is the biggest single overhang in tech; a forced divestiture of Chrome or AdTech would be material
  • Search disruption: If users genuinely shift to ChatGPT/Anthropic for high-intent queries, ad revenue erodes faster than Cloud can replace
  • Capex: $180–190B in 2026 with “significantly increase” guided for 2027 — at some point, investors revolt
  • Execution: Gemini still lags GPT-class models on some benchmarks despite improvements

Pick #3: TAIWAN SEMICONDUCTOR (TSM)

A. Investment Thesis

  • The single chokepoint of the entire AI build-out — Nvidia, AMD, Apple, Broadcom, Google TPU all manufacture here, no alternative exists at leading-edge nodes
  • HPC accounted for 61% of Q1 2026 revenue, up from ~52% a year ago — AI is structurally re-mixing the company toward higher-margin work CNBC
  • Management raised full-year 2026 USD revenue growth guidance to “above 30%” — TSMC almost never raises guidance; this is unprecedented confidence TipRanks
  • Pricing power is real: TSMC raised advanced node prices in early 2026, and customers paid; gross margin expanded 390 bps QoQ to 66.2%
  • “Demand still significantly outpaces supply” — sold-out conditions are expected to define the industry through 2026, CNBC

B. Financial Strength Q1 2026: revenue $35.9B (+40.6% YoY USD), gross margin 66.2%, operating margin 58.1%, EPS up 58.3% YoY. ROE of 40.5%. The financial inflection point: 2nm ramp in late 2026 will pressure margins 2–3% near-term but expand them substantially as yields mature in 2027–2028 — this is the classic “buy the dip in margins” setup. TickeronICO Optics

C. AI Leverage the most leveraged company in the world to AI capex on a fundamentals basis. NVIDIA alone contributes ~22–25% of TSMC’s sales. Every dollar of hyperscaler capex on chips passes through this fab. Position in the stack: the foundation of the foundation. TECHi®

D. Competitive Edge Process node leadership is roughly 2–3 years ahead of Samsung, 4–5 years ahead of Intel. Catching up requires not just capital but accumulated process knowledge that takes a decade. Apple, Nvidia, and AMD have all signaled long-term commitments to TSMC for leading-edge.

E. Valuation Reality Check Forward P/E of ~26x, ranking better than 67% of semiconductor peers. For a company with monopoly-like positioning and 30%+ growth, this is the most attractive risk/reward of the three on a pure multiple basis. For a 2–3x return: Revenue compounds at 25%+ for 3 years, gross margin holds at 60%+ post-2nm ramp, Taiwan geopolitical risk doesn’t materialize, US/Japan/Germany fabs reach economic productivity. Base case = ~70–90% upside, bull case = 2.2x. GuruFocus

F. Risk Factors

  • Geopolitical: Taiwan invasion/blockade is the single largest tail risk in global equities — unhedgeable, low probability, infinite consequence
  • Customer concentration: Nvidia + Apple = ~40% of revenue
  • Cyclicality: Foundry industry has historically been brutally cyclical; if AI capex pulls back even 20%, TSMC’s growth deceleration would be sharp
  • Capex strain: $52–56B in 2026 capex with overseas fabs (Arizona, Japan, Germany) carrying margin dilution near-term ICO Optics

4. RANKING — CONVICTION SCORECARD

NVDA GOOGL TSM
Expected Return (3–5 yr) 8/10 7/10 8/10
Risk Level Medium-High Medium Medium-High
Time Horizon Medium (2–3 yr) Long (3–5 yr) Long (3–5 yr)
Asymmetry High Medium-High High
Verdict BUY BUY BUY

Why GOOGL ranks lower on return but is my highest-conviction risk-adjusted pick: The full-stack AI position with embedded Search cash flows means downside is more bounded than NVDA or TSM. You give up some upside for resilience. NVDA and TSM are higher-beta plays on the same thesis.


5. PORTFOLIO STRATEGY

Suggested allocation across the three (within whatever portion of your portfolio is allocated to AI/tech equities):

  • GOOGL: 40% — anchor position, lowest risk-adjusted entry
  • NVDA: 35% — direct AI capex beneficiary, attractive valuation given growth
  • TSM: 25% — highest geopolitical risk, sized down accordingly despite best valuation

Entry strategy: staged, not lump sum.

  • The macro setup is uncomfortable: hyperscaler stocks have absorbed most of the bullish revisions, and Meta’s 6% drop on capex guidance shows investor patience is conditional. A lump-sum entry exposes you to a bad multiple-compression quarter.
  • Recommended approach: deploy capital in 3 tranches over 6–9 months. Tranche 1 (40% of the intended position) now. Tranche 2 (30%) after the next major drawdown of 8%+ in the basket. Tranche 3 (30%) opportunistically over months 6–9.
  • TSM specifically: I would scale in even more slowly given the China-Taiwan tail risk; consider adding only on weakness.

What invalidates the thesis (the disciplined sell triggers):

  1. Hyperscaler capex guide-down. If two of {MSFT, GOOGL, AMZN, META} cut 2027 capex guidance by >15%, the entire chain re-rates lower. Sell into the news, don’t average down.
  2. Cloud growth deceleration to <30%. Google Cloud at 63% is the bull signal. If it drops below 30% YoY for two consecutive quarters, the AI-monetization thesis is breaking.
  3. Sustained gross margin compression at TSM below 55% would suggest pricing power is breaking — exit.
  4. NVIDIA’s gross margin below 65% would signal either AMD/custom-silicon competition is biting or pricing concessions are happening — reduce.
  5. Taiwan kinetic event. Eliminate TSM exposure immediately; reduce NVDA by half.
  6. DOJ forces structural divestiture at Google. Re-evaluate GOOGL completely — could be net positive (unlocks SOTP) or net negative depending on remedy.

Final Capital Allocator’s Note

The capex numbers in this cycle are genuinely staggering, and bear asking “where’s the ROI?” are not stupid. But the right framing isn’t “is AI capex justified in aggregate?” — it’s “who captures the rent regardless of whether it is?”

These three names capture the rent. NVIDIA gets paid whether the AI applications work or not. TSMC gets paid whether Nvidia’s customers are smart or dumb. Alphabet gets paid because its existing cash machine subsidizes the AI investments and benefits from them simultaneously.

If the AI bubble pops, all three drop 30–50%. If it doesn’t, these three return 80–150% over 3–5 years. The asymmetry is in the survivors’ favor because they each occupy structural chokepoints that don’t disappear in a downturn — they just trade at lower multiples temporarily.

Position size accordingly. Don’t be the investor who’s right on thesis but wrong on sizing.


This analysis reflects publicly available data as of early May 2026. Markets move; these break. Re-underwrite quarterly.
TAGS

EXPLORE MORE ON:

Abu Dhabi F1 race December 2026

Formula One has confirmed the Abu Dhabi F1 race in December 2026 will close the championship at Yas Marina Circuit, with the event running from December 3 to 6. Stefano Domenicali, President and CEO of Formula One, said the schedule stands as published. “The calendar is confirmed,” he said. He added preparations are near complete and a small number of seats remain unsold.

That statement settles a question left open for much of the year. Regional tensions linked to the Iran war had raised doubts about whether the championship could stage its closing rounds in the Gulf. Two races in the region were already lost. Bahrain and Saudi Arabia were cancelled, and the Bahrain round was later rescheduled to October 4 at a circuit in Malaysia. Qatar keeps its November 29 slot, which places two Gulf events back-to-back at the end of the 2026 F1 calendar.

A Finale with a Long Record

Yas Marina Circuit joined the schedule in 2009 and has staged the F1 season finale every year since 2014. Five drivers have taken world titles at the venue. It sits on Yas Island, a purpose-built leisure district east of the capital, and the layout runs from daylight into floodlit night. Race day falls on Sunday, December 6, and the Abu Dhabi F1 race in December 2026 will be the last round of the year.

What the Abu Dhabi F1 race December 2026 means for the emirate

Saood Abdulaziz Al Hosani, Undersecretary of the Department of Culture and Tourism in Abu Dhabi, said hosting the championship since 2009 has created opportunities across tourism, hospitality and the events sector. He said organisers look forward to receiving international fans for the close of the season.

The weekend is built around more than track running. Concerts and hospitality programmes operate across Yas Island through the four days. Confirmed acts include Zara Larsson, Lewis Capaldi and Imagine Dragons, with further names expected. Saif Rashid Al Noaimi, chief executive of promoter Ethara, said work at the circuit continues on schedule. Abu Dhabi Grand Prix tickets are close to sold out, and organisers have advised fans to check what remains before the weekend.

The Wider Economic Reading

For the emirate, the value of the Abu Dhabi F1 race in December 2026 rests in the programme built around it rather than the race alone. Al Hosani framed the fixture as a source of activity in tourism, hospitality and events, three sectors Abu Dhabi has expanded as part of a longer move away from dependence on oil revenue. Qatar and Saudi Arabia have taken similar routes, using major sporting fixtures to draw visitors and build service industries with year-round demand.

The confirmation also carries a signal about scheduling risk. Formula One has shown it will move or drop rounds when conditions require it, as the Bahrain relocation showed. Holding the finale in place tells host cities across the region that contracts remain workable. For Abu Dhabi Grand Prix 2026, that assurance arrives at the point when hotels, airlines and tour operators need certainty to sell the weekend.

Whether the drivers’ title is still open when the field reaches Yas Marina will shape global attention on the race. The commercial case for the event no longer depends on that alone.

HNWI Wealth 2026 Trends

HNWI wealth 2026 trends center on a record year, with global high-net-worth individual wealth rising 8.7 percent in 2025 to USD 98.3 trillion. Capgemini Research Institute published the figure in the 30th edition of its World Wealth Report 2026. High-net-worth individuals, or HNWIs, hold at least USD 1 million in investable assets, not counting a primary home, collectibles, or consumer durables. Equity markets did most of the work, and easing inflation helped. The global millionaire population grew by almost 2 million people to 25.3 million. That was the largest single-year wealth increase since 2018.

Where the new millionaires came from

Asia-Pacific recorded the strongest regional result, with wealth up 10.5 percent and population up 9.4 percent as semiconductor demand lifted Asian stock markets. Japan added 436,000 millionaires, and China added 154,000. India gained 11,300, and Australia gained 18,100. North America saw its HNWI population rise 9.1 percent. The United States added 736,000 new millionaires, more than any other country, taking its total to 8.7 million. Canada’s HNWI population rose 6.7 percent, or roughly 30,000 people. Europe returned to growth at 6.5 percent after falling in 2024, helped by steadier equity markets.

Luxembourg posted a 13.5 percent increase and Germany 11.1 percent, while France and the United Kingdom recorded 2.7 percent and 2.6 percent. Africa grew 4.1 percent on higher precious metal prices, with Morocco the fastest at 16.8 percent. Latin America was nearly flat at 0.3 percent, though Mexico’s HNWI wealth rose 5.4 percent. The Middle East was the only region to contract, down 1.4 percent, as lower oil prices, regional conflict and labour market strain weighed on Gulf economies, the Capgemini report mentioned.

HNWI portfolio allocations move back toward equities

HNWI portfolio allocations shifted as markets rallied. Equities reached 25 percent of portfolios as of January 2026, up three percentage points on the year, on the back of strong corporate earnings and technology sector gains. Fixed income rose two points to 20 percent after bond markets delivered their best returns since 2020. Alternative investments, a group covering private equity, hedge funds, commodities, currencies, structured products and digital assets, slipped to 12 percent as public equities outperformed. Appetite has not faded. Two in three HNWIs, or 68 percent, plan to increase private equity exposure.

Gains clustered at the top. Ultra-high-net-worth individuals, those with USD 30 million or more, numbered about 250,000 after a 9.4 percent rise, and their wealth grew 9.7 percent. Concentration runs through the HNWI wealth 2026 trends data, with the top 1 percent of HNWIs holding 34.8 percent of all HNWI wealth.

What HNWI wealth 2026 trends mean for advisers

Clients no longer stay put. Exclusive relationships have halved in six years. In 2019, 39 percent of HNWIs used a single firm. By 2025, that share had fallen to 19 percent. Product access explains much of the move, with 88 percent saying they work with several firms to reach alternative investments. WealthTechs, single-family offices and robo-advisory platforms are taking share from established players. Kartik Ramakrishnan, CEO of Capgemini’s Financial Services Strategic Business Unit, called the period a clear inflection point for the industry and pointed to an estimated USD 1.5 trillion in new assets that moved to competitors of traditional firms between 2022 and 2025.

Operating models under pressure

Among the wealth management trends 2026 has brought into view, client experience carries the most weight. Only 17 percent of HNWIs call their advisory experience seamless and personalised, and 42 percent have had to repeat their goals to the same firm more than once. Nearly all firms, 97 percent, still sort clients by assets under management rather than by behaviour. Six in ten executives say their firms lack a single view of the client, which leaves work duplicated across teams. Advisers spend 41 percent of their time on operational tasks. Three quarters want AI-enabled systems to handle routine work, and 61 percent want access to a wider group of specialists. HNWI wealth 2026 trends suggest the payoff sits in retention, since 53 percent of satisfied HNWIs recommend their firm and 47 percent consolidate assets with it.

Dubai Free Zones Ranked

Dubai free zones all advertise the same headline benefits: 100 percent foreign ownership, zero corporate and personal tax, and full repatriation of profits. Price and sector fit are where Dubai free zones differ. A founder paying AED 25,000 for a DIFC license and a founder paying AED 12,900 for an IFZA package are buying two different products, and both are called a free zone license.

Dubai has positioned itself between East and West, supported by advanced infrastructure, pro-business regulation, and a globally connected economy. Over the past two decades, the emirate has engineered an ecosystem built to attract international capital, entrepreneurs, and high-growth companies across sectors from finance and technology to logistics and media. Dubai free zones sit at the center of that strategy. They are specialized economic areas offering 100 percent foreign ownership, tax incentives, streamlined licensing, and sector-specific support.

These zones are not fixed entities. They compete, and they revise their offerings every year to win new businesses. That competition has sharpened the value proposition on the buyer side. Regulations have loosened, setup has accelerated, and incentives have become more tailored to specific activities.

Serve Global Finance and Capital Markets

Not all free zones are created equal. Each is designed with a distinct strategic focus, aligning infrastructure, licensing frameworks, and regulatory support with specific industries. Some are built to serve global finance and capital markets. Others accelerate innovation in technology and AI. Several are optimized for trade, logistics, or creative industries. That specialization lets a company plug directly into an ecosystem matched to its operational needs and growth ambitions.

In this report, ICN Media examines the top 10 free zones in Dubai, evaluating their competitive advantages, sector alignment, and strategic positioning within the wider economy. The objective is clear: to identify where opportunity, efficiency, and long-term value converge for companies entering or expanding within the UAE market.

How to read this list of Dubai free zones

Each entry carries the same five data points: year of establishment, official website, registered companies, registration prices, and major business types. Pros and cons follow. Registration prices are entry points, not total business setup costs in Dubai, and they move with license type, visa count, and office solution.

1. Jebel Ali Free Zone (JAFZA)

Year of establishment: 1985

Official website: www.jafza.ae

Registered companies: 11,000 plus

Registration prices: from AED 15,000 (FZCO), FZE from AED 10,000; office and warehouse rentals vary.

Major business types: logistics, trading, manufacturing, food and beverage.

Pros: prime location near Jebel Ali Port, strong global connectivity, wide range of facility options.

Cons: higher setup and rental costs, more regulated compliance requirements.

Established in 1985, Jebel Ali Free Zone is the UAE’s oldest and largest free trade zone, spanning over 57 square kilometers next to Jebel Ali Port. More than 11,000 companies from over 150 countries operate here, including over 100 Fortune Global 500 firms. JAFZA is a logistics and trade supernode handling billions in annual trade. Its integration with the port, proximity to Al Maktoum and Dubai International Airports, and access to 150 global ports suit manufacturing, warehousing, distribution, and re-export businesses. The zone offers 100 percent foreign ownership, full repatriation of profits, zero corporate or personal taxes, and ready-made industrial facilities. Setup costs and compliance run higher than newer zones. For businesses built on international trade, logistics, and industrial operations, the global connectivity, established infrastructure, and location are unmatched.

2. Dubai Multi Commodities Centre (DMCC)

Year of establishment: 2002

Official website: www.dmcc.ae

Registered companies: 26,000 plus

Registration prices: from AED 20,265 (specific trading), flexi-desk from AED 16,000 per year.

Major business types: commodities trading, fintech, consulting, crypto, tech.

Pros: globally recognized free zone, active business community in JLT, supports up to 6 activities per license.

Cons: higher licensing and office costs, competitive market saturation.

Founded in 2002, DMCC is Dubai’s premier free zone for commodities trading, fintech, and professional services, based in Jumeirah Lakes Towers. Over 26,000 registered companies and more than 90,000 professionals make it one of the world’s fastest-growing free zones. Licensing is flexible enough to carry six activities on a single free zone license, covering trading, consulting, crypto, AI, and gaming. Premium office space and strong government backing draw entrepreneurs and multinationals alike. Members also get access to the DMCC Crypto Centre, commodity trading platforms, and an extensive networking calendar. Licensing and office costs sit above average. What DMCC sells in return is credibility, and for traders, fintech firms, and service businesses that trade on reputation, the global standing and business-friendly regulations justify the premium.

3. Dubai Airport Free Zone (DAFZA)

Year of establishment: 1996

Official website: www.dafza.ae

Registered companies: 2,300 plus

Registration prices: from AED 15,000 and up; varies by activity.

Major business types: aviation, logistics, IT, pharmaceuticals, trading.

Pros: located within Dubai International Airport, fast customs clearance, 100 percent foreign ownership and tax exemptions.

Cons: limited office space availability, premium pricing for facilities.

Launched in 1996, Dubai Airport Free Zone sits inside Dubai International Airport, with direct access to global air cargo and passenger networks. Over 2,300 companies from more than 120 countries operate here, concentrated in aviation, logistics, IT, pharmaceuticals, and high-value trading. Businesses receive 100 percent foreign ownership, zero corporate or personal taxes, full profit repatriation, and streamlined customs clearance. Office, warehouse, and land options are flexible, licensing is fast, and bureaucracy is minimal. Proximity to the runway matters most for time-sensitive industries: e-commerce, perishable goods, and express logistics. Facility costs are premium and space availability is limited. For any operation that lives or dies on speed, international reach, and clean import and export flows, DAFZA’s connectivity and regulatory efficiency carry the case.

4. Dubai Internet City (DIC)

Year of establishment: 2000

Official website: www.dic.ae

Registered companies: 1,600 plus

Registration prices: from AED 15,000 and up; service and license fees vary.

Major business types: IT, software, digital marketing, tech startups.

Pros: tech-focused ecosystem, proximity to talent and investors, strong government support for innovation.

Cons: higher office rental costs, competitive environment.

Established in 2000, Dubai Internet City is the Middle East’s leading technology and innovation hub, hosting over 1,600 tech companies and more than 25,000 professionals. Part of the TECOM Group, DIC houses Microsoft, Google, IBM, and Meta, alongside a long tail of startups and digital agencies. IT, software development, digital marketing, e-commerce, and tech innovation all have a home here, with access to talent, investors, and government support programs. Licensing is flexible, and the property mix runs from co-working desks to premium offices in a collaborative setting. Sitting near Dubai Marina and the main business districts helps with networking and recruitment. Office rents and licensing fees run above average. For technology firms, digital entrepreneurs, and innovation-driven businesses chasing scale and credibility, the concentration of tech talent settles the argument.

5. Dubai Media City (DMC)

Year of establishment: 2000

Official website: www.dmc.ae

Registered companies: 3,000 plus

Registration prices: from AED 15,000 and up; varies by activity.

Major business types: media production, advertising, PR, content creation.

Pros: dedicated media ecosystem, access to studios and production facilities, strong industry networking.

Cons: higher costs for premium facilities, focused primarily on media sectors.

Founded in 2000 alongside DIC, Dubai Media City is the region’s largest and most influential media-focused free zone, with over 3,000 companies and more than 34,500 professionals. Also part of the TECOM Group, DMC hosts CNN, BBC, Reuters, and Sony, plus advertising agencies, production houses, and content creators. Facilities include broadcast-grade production spaces, studios, and retail, set inside a working creative community. Media, advertising, PR, publishing, and digital content businesses license flexibly, with 100 percent foreign ownership and zero taxes. Location near Dubai Marina and next to DIC makes collaboration between tech and media companies straightforward. Premium facilities cost more, and the sector focus is narrow by design. For media, entertainment, and creative businesses building reach and influence, the ecosystem and industry support have no regional equivalent.

6. Dubai Silicon Oasis (DSO)

Year of establishment: 2003

Official website: www.dso.ae

Registered companies: 28,000 plus, including tech parks.

Registration prices: from AED 12,000 and up; flexi options available.

Major business types: IT, electronics, manufacturing, e-commerce.

Pros: affordable licensing and office options, strong focus on tech and light manufacturing, integrated residential and commercial community.

Cons: slightly farther from central Dubai, less prestige compared to DMCC or DIFC.

Launched in 2003, Dubai Silicon Oasis is a technology and industrial free zone with over 28,000 companies and more than 90,000 professionals. The site combines residential, commercial, and industrial facilities across one integrated community, which suits tech firms, e-commerce operators, electronics makers, and light manufacturers. Licensing is affordable, office and warehouse options are flexible, and government support for innovation and SMEs is active. Eleven industry clusters encourage collaboration across IT, healthcare, clean tech, and advanced manufacturing. Access to central Dubai and Abu Dhabi runs through Sheikh Mohammed Bin Zayed Road. Prestige is the gap: DSO does not carry the name recognition of DMCC or DIFC. Startups, SMEs, and tech-driven businesses that need affordability and room to scale tend to accept that trade willingly.

7. Dubai International Financial Centre (DIFC)

Year of establishment: 2004

Official website: www.difc.ae

Registered companies: 3,000 plus, estimated.

Registration prices: from AED 25,000 and up; varies by license type.

Major business types: finance, fintech, professional services, legal.

Pros: common law regulatory framework, global financial hub reputation, access to institutional investors.

Cons: high setup and operational costs, strict compliance and regulatory requirements.

Established in 2004, DIFC is the Middle East’s leading financial free zone, operating under a common law regulatory framework independent of UAE civil law. Over 5,000 registered companies and more than 500 billion dollars in assets under management sit inside it, spanning global banks, fintech startups, asset managers, and professional service firms. The centre offers 100 percent foreign ownership, zero corporate taxes, and a DFSA-regulated environment that carries real weight with investors. Its Gate District holds premium offices, retail, and dining, while the DIFC Courts provide international dispute resolution. Setup and operational costs run significantly higher than every other zone on this list. Financial institutions, fintech innovators, and professional services firms targeting regional and global capital pay that premium for regulatory excellence and access to institutional money.

8. Dubai Design District (d3)

Year of establishment: 2013

Official website: www.d3.ae

Registered companies: 4,600 plus

Registration prices: from AED 15,000 and up; varies by activity.

Major business types: fashion, design, architecture, creative agencies.

Pros: creative-focused ecosystem, access to studios, retail, and event spaces, strong branding and networking opportunities.

Cons: higher costs for premium spaces, niche focus limits non-creative businesses.

Founded in 2013, Dubai Design District is the Middle East’s dedicated creative hub for fashion, design, architecture, and innovation. Over 4,600 companies operate from purpose-built studios, retail spaces, galleries, and event venues across a walkable community. Fashion labels, design agencies, architects, and creative entrepreneurs get flexible licensing, 100 percent foreign ownership, and zero taxes. Dubai Design Week and Dubai Fashion Week both run here, which puts exposure and networking on the calendar rather than leaving them to chance. Downtown Dubai and Dubai Creek are minutes away. Premium space costs more, and the niche focus rules out most non-creative businesses. Design-driven companies looking for collaboration, visibility, and growth in the regional and global creative economy get an infrastructure and government backing combination that no other zone replicates.

9. Meydan Free Zone

Year of establishment: 2014

Official website: www.meydanfreezone.com

Registered companies: not publicly disclosed, growing rapidly.

Registration prices: from AED 13,000 and up; flexi packages available.

Major business types: consulting, e-commerce, digital services, trading.

Pros: fully digital setup process, affordable licensing options, flexible business activities.

Cons: less established reputation, limited physical infrastructure.

Launched in 2014, Meydan Free Zone is the UAE’s first fully digital free zone, built for entrepreneurs and SMEs who want setup to be fast, cheap, and flexible. Located near Meydan Racecourse, it runs 100 percent online licensing with zero paperwork, and companies can operate remotely or from flexible office space. Consulting, e-commerce, digital services, and trading are all supported, with packages starting at AED 13,000. Members receive 100 percent foreign ownership, zero taxes, and entry into Dubai’s business ecosystem without renting a physical office. Infrastructure and prestige are thinner than at the larger zones. Rapid setup, often within 24 hours, plus the digital-first process and low cost, make Meydan a fit for startups, freelancers, and digital entrepreneurs who value agility inside a reputable Dubai jurisdiction.

10. International Free Zone Authority (IFZA)

Year of establishment: 2019

Official website: www.ifza.com

Registered companies: not publicly disclosed; rapid growth.

Registration prices: from AED 12,900 and up, includes 3 activities.

Major business types: consulting, e-commerce, trading, services.

Pros: low-cost setup with flexible packages, fast licensing in 3 to 5 days, allows combination of trading and consulting.

Cons: newer zone with less brand recognition, limited physical office options.

Established in 2019, IFZA is one of Dubai’s fastest-growing free zones, aimed squarely at startups and SMEs that need an affordable, flexible setup. Based in the heart of Dubai, it provides 100 percent foreign ownership, zero corporate taxes, and full profit repatriation, with packages from AED 12,900 covering up to three business activities. Consulting, e-commerce, trading, and professional services are all supported, and approvals often land within 3 to 5 days. Virtual offices and co-working spaces cover the facility requirement, which keeps entry costs low while still connecting members to Dubai’s business network. IFZA is newer and less established than DMCC or DIFC. Entrepreneurs, digital businesses, and SMEs who want a credible Dubai presence on minimum capital and maximum agility make up most of its base.

What the price spread across Dubai free zones buys

Entry pricing across these ten runs from AED 12,900 at IFZA to AED 25,000 and up at DIFC. The gap is not arbitrary. IFZA sells speed and low cost. DIFC sells a common law court system and a regulator that institutional investors already trust. JAFZA sells 57 square kilometers of port-adjacent land. DMCC sells six activities on one license and a name that opens bank accounts.

A company optimizing for the lowest Dubai free zone company setup cost will land at IFZA, Meydan, or DSO. A company that will raise institutional capital or holds client money belongs in DIFC regardless of the invoice. Trading physical goods points to JAFZA or DAFZA. Media, design, and technology each have a purpose-built address in DMC, d3, and DIC.

The question is not which is the best free zone in Dubai. It is which zone charges for something a specific business will use. Everything else is overhead with a good address.

Share this post

on your favourite social platforms

or copy the link